Introduction
In September of last year, I created a topic going over my findings on what is causing the significant lag in Arcane Odyssey. It was a quickly written post with not a lot of in-depth analysis. Today, I decided to dump Arcane Odyssey once more and try to come to a closer conclusion on what was really causing the lag in Arcane Odyssey–now that we have Occlusion Culling and other miscellaneous optimizations to the Roblox Engine. Fortunately, and unexpected to me, I have been able to come up with a general explanation for why the game suffers these problems.
As always, note before going ahead: all of the information I have collected here come from a single MicroProfiler dump and should not be used as a complete source of evidence for any problems with Arcane Odyssey’s performance. It is important to test on multiple times and on multiple devices.
Moving along,
Findings
I launched Arcane Odyssey and took a MicroProfiler dump within a minute of joining. An upload of the dump is attached here: https://drive.google.com/file/d/1s3vmgv6eyDr-kIiNcTyoeJWu5BqgA7fd/view?usp=drive_link
MicroProfiler dumps can be complex, so let me break this down:

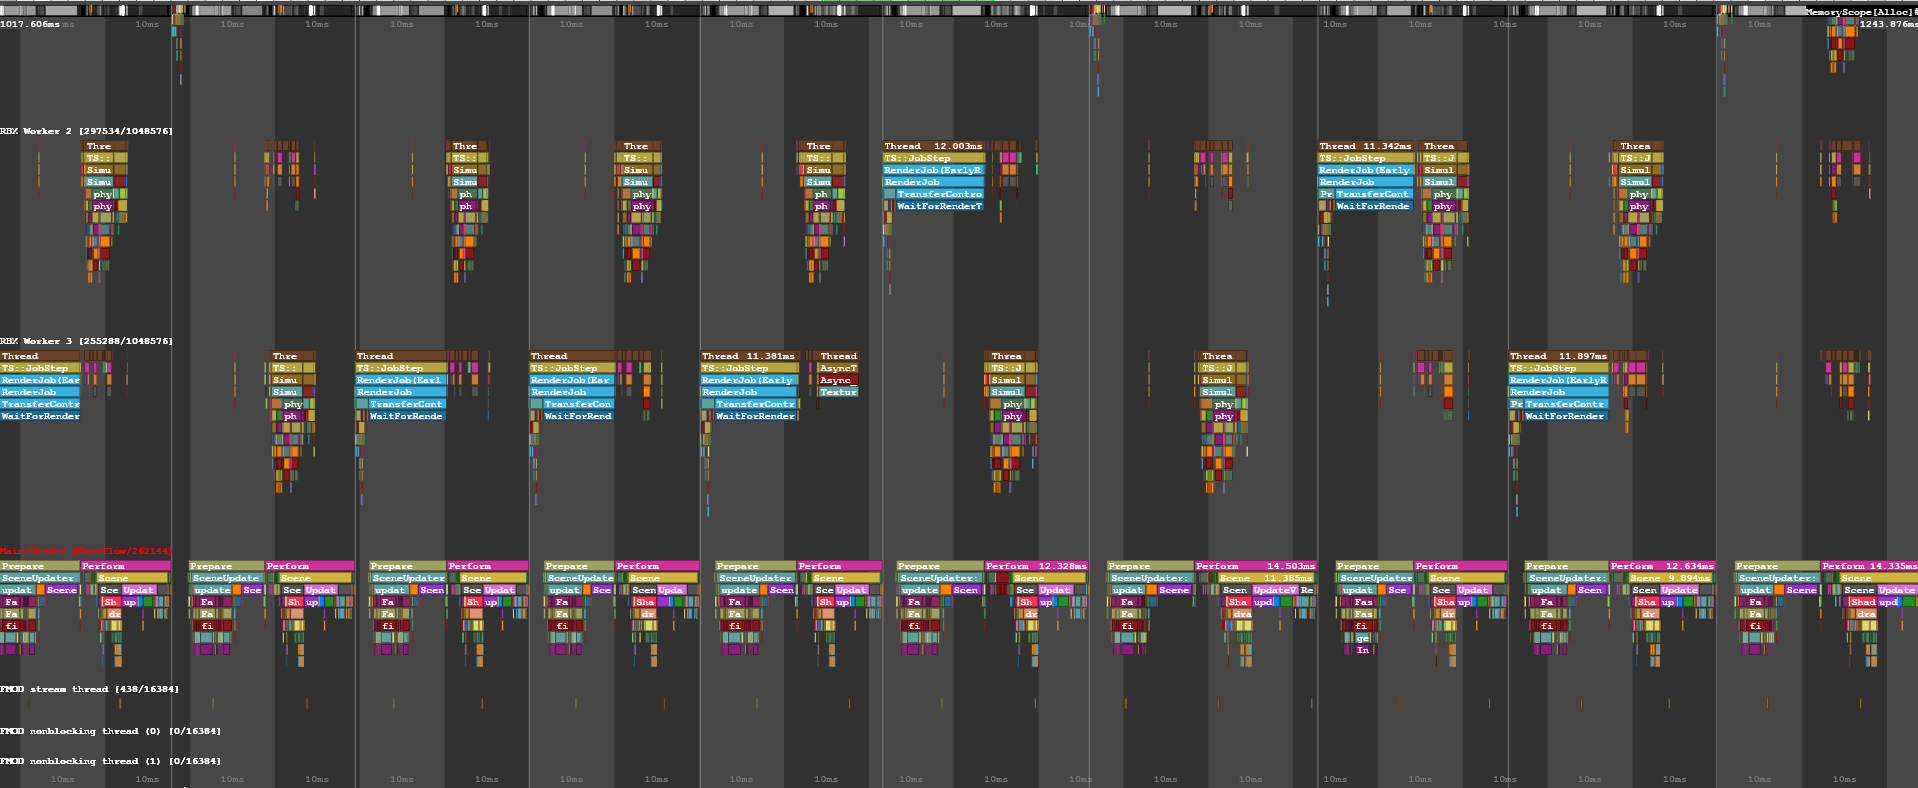
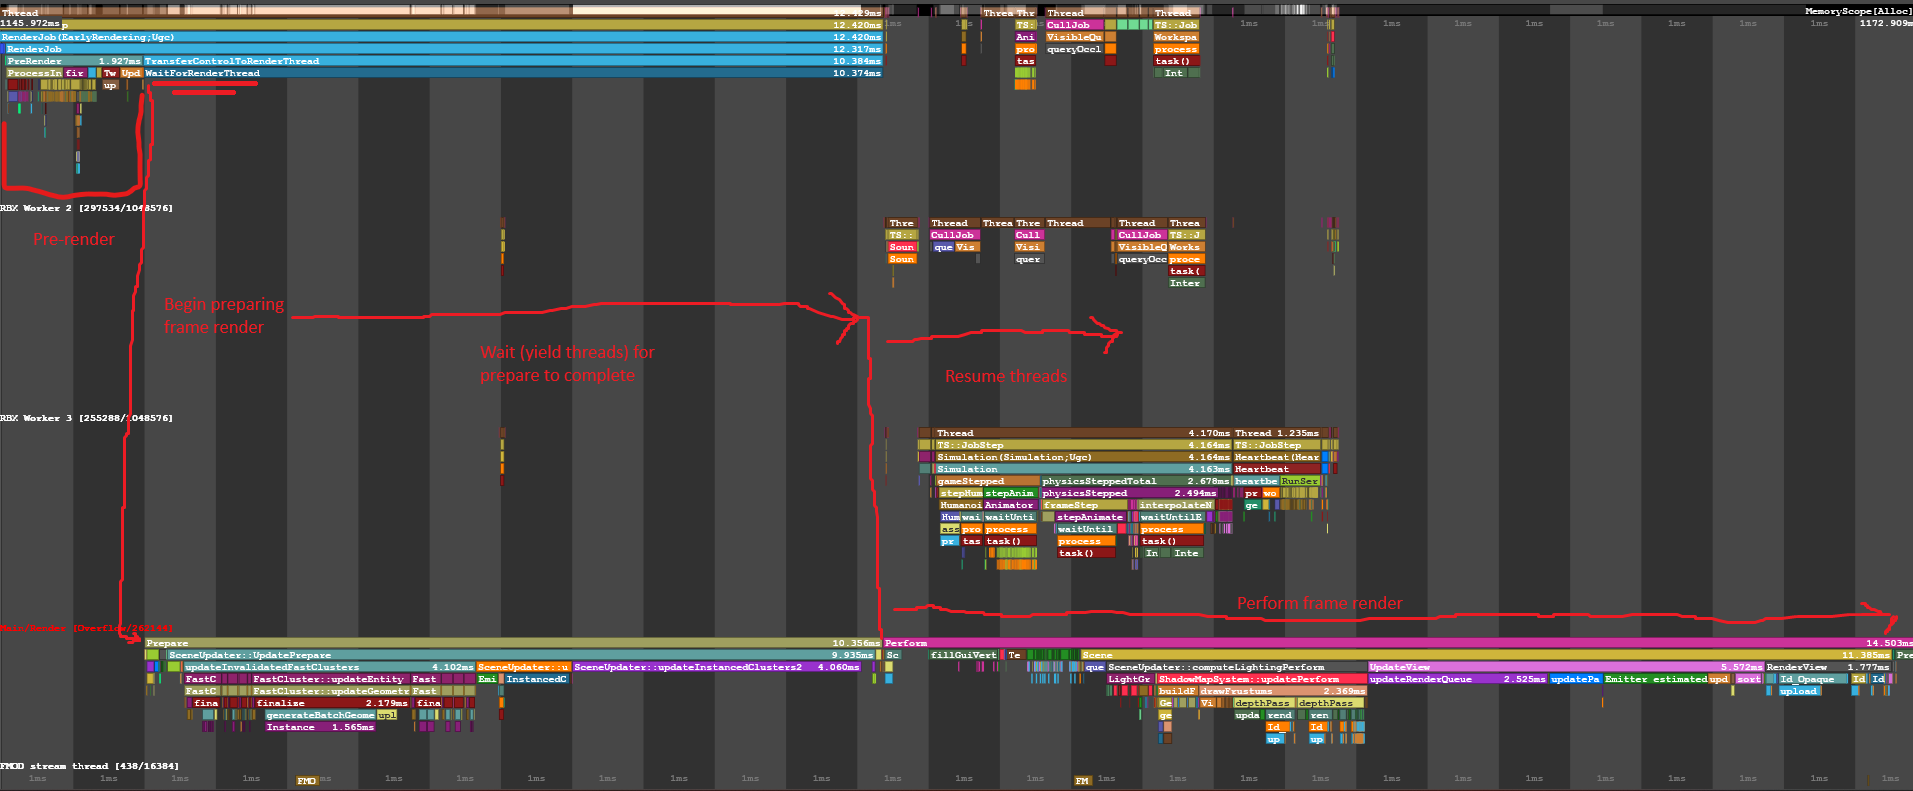
Here I am zoomed in on the frame with the highest render wall time, and straight away, we can see many different threads (some happening parallel). We especially see that the one on the bottom seems extremely long and consists of two parts: prepare and perform. Ideally, we would want our prepare time to be as small as possible, but why is that? That is because the prepare thread yields EVERYTHING from continuing until it is over, which is not ideal to have high if we want good FPS. Many Roblox games do not face this prepare time issue, but Arcane Odyssey does. Here is an annotated version of the screenshot for better understanding (zoom in if you cannot read it well), along with the MicroProfiler CPU FlameGraph and Memory allocations by size FlameGraph:
Annotated Capture
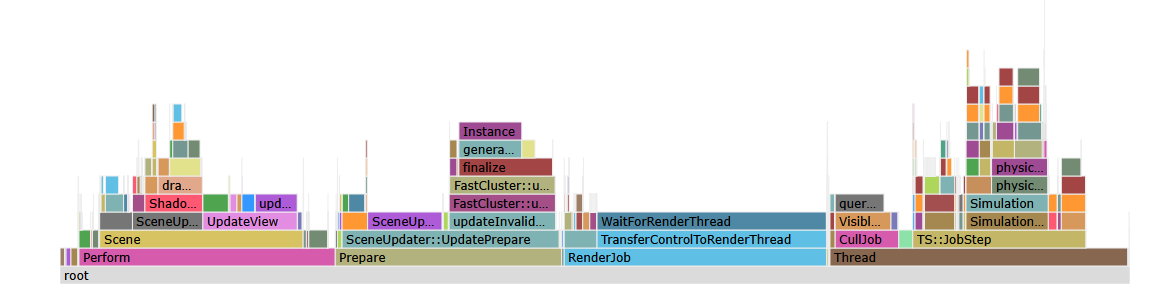
CPU FlameGraph
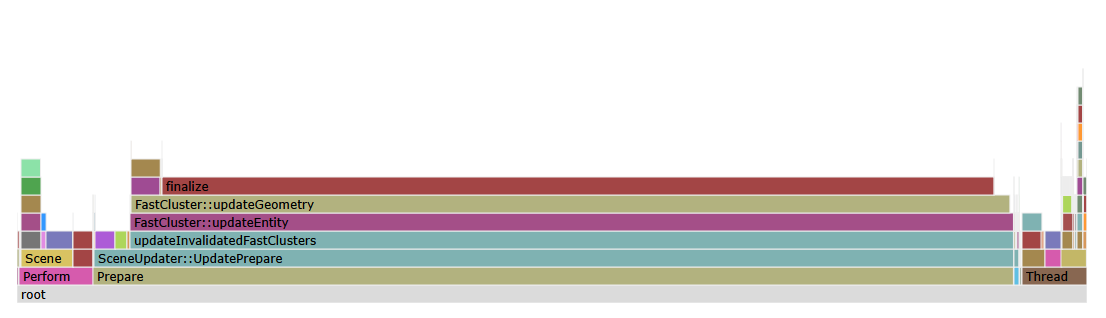
Memory FlameGraph (by allocation size)
Now what can we do to reduce the amount of time it takes to prepare the rendering process, well …
Solutions
1. Reduce usage of unnecessary humanoids, and remove the humanoid instance from non-humanoid objects/entities.
When taking a look at the Capture and CPU FlameGraph, much of prepare is taken up by a tag called updateInvalidatedFastClusters. According to the Roblox MicroProfiler Tag reference, this is for preparing FastClusters which are usually used to render Humanoids.
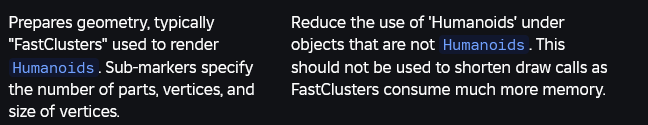
If Arcane Odyssey can reduce the amount of Humanoids, especially under non-humanoid objects, we might be able to significantly improve the speed of Perform.
2. Reduce mesh and material variation.
Another major tag is the updateInstancedClusters. Again, according to the tag reference, this prepares static geometry that use instanced rendering–like parts or meshes. We can reduce the amount of instanced clusters by checking if same meshes share the same ID – then grouping them if not – , getting rid of unneeded/redundant materials and meshes, and grouping together certain sets of materials/meshes if possible.
My take
I believe a lot of this will be solved (at the least updateInvalidatedFastClusters could be reduced a bit) when occluded characters begin to be culled, along with other types:
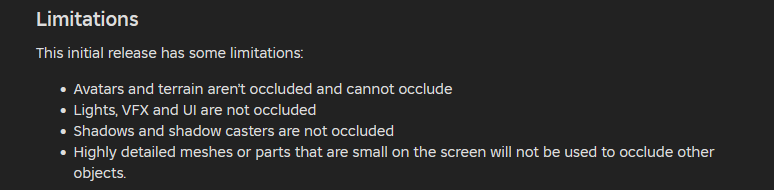
We have to wait and see until it is added to occlusion culling, but ultimately, a lot of this is up to Vetex to fix. I am not a developer for the game, so many things I cannot speak on how to tackle.
Closing remarks
I will be keeping this topic/thread updated throughout this year, so be sure to come back, there will possibly be new information! If anyone else knows anything, feel free to let me know–there is a lot to dissect, and I cannot catch everything. And remember, feel free to ask any questions, as I will try to the best of my ability to answer them!
Device Specifications
These are my specs I used to conduct these tests:
CPU: AMD Ryzen 5 5600X 6-Core @ 3.70 GHz
GPU: Nvidia RTX 3070
RAM: 32.0 GB DDR4
OS: Windows 11 Pro 24H2 10.0.261000 Build 26100