hey
FUCKERS
wait, we’ve been here before, haven’t we?
oh well
SO! literally two days ago, I made a Desmos Graph That Tells You How Fast You Die (To Drawback)
The problem with this graph? Well, two days ago, I wasn’t all there, and while making the graph I forgot to include the lines that literally tell you the asymptote for regeneration relative to your drawback.
Don’t know what any of that means?
TOO FUCKING BAD!!
Anyways, I updated the graph (every time you save a desmos graph it regenerates the URL which is super annoying, and why I need to make a new topic. Sorry, mods.)
I’ll actually explain how the graph works below, but here’s the link to the graph. There are explanations for the functions and a brief summary of how to use Desmos
or you can just read the summary below.
The graph:
The explanation:
The y-axis will always represent the current HP.
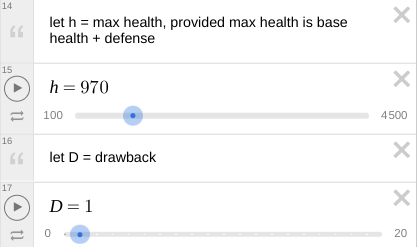
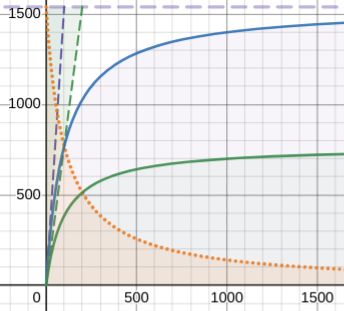
There are a total of 6 lines and 2 adjustable variables.
Of the two variables:
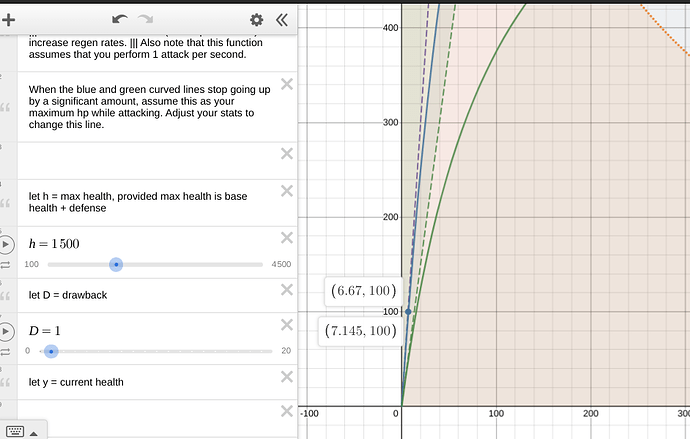
h = Maximum HP (which is base HP + defence)
D = Drawback (your total Drawback)
You can adjust these by moving these sliders:
Of the 6 lines:
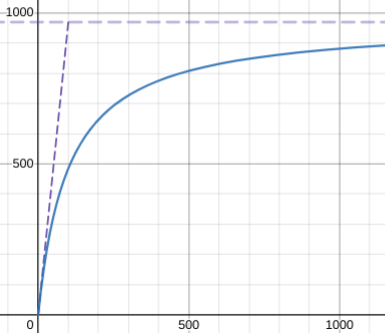
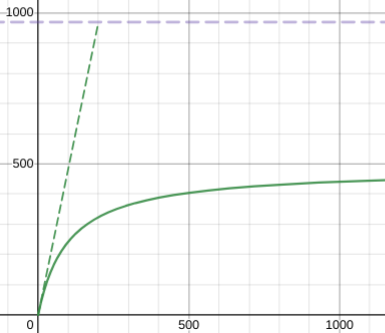
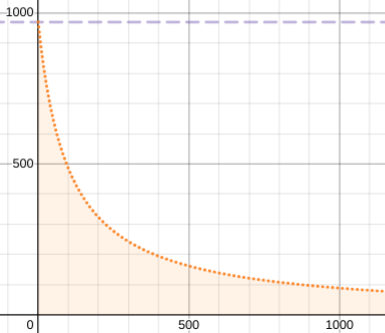
Light blue dotted line at the top: Visually shows maximum HP
Blue lines: Regen rate* out of combat
Green lines: Regen rate* in combat
*Lines that represent regen rate will start from 1 HP and increase
Blue dotted line: Regen rate (not in combat, no drawback)
Will always take 100 seconds to go from 1 hp to maximum HP
x-axis represents time in seconds
Green dotted line: Regen rate (in combat, no drawback)
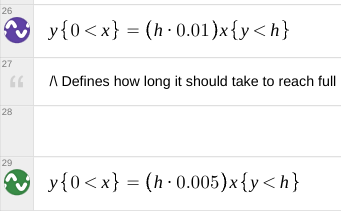
Will always take 200 seconds to go from 1 hp to maximum HP
x-axis represents time in seconds
Yellow dotted line: The rate that you will lose HP to drawback, without regen
Will never touch 0, but will get very close.
x-axis represents the number of attacks
Blue solid line: The rate that you will regen, provided that you are attacking and not in combat.
Shows when your regen out-heals your drawback damage.
x-axis represents time in seconds. this line assumes that you attack once every second.
Green solid line: The rate that you will regen, provided that you are attacking and in combat.
Shows when your regen out-heals your drawback damage.
x-axis represents time in seconds. this line assumes that you attack once every second.
Mildly obscure Desmos tricks:
I’m insecure and worried that people are DUMB!!!
In Desmos, if you click on a line, it will show you the coordinates.
If you are visually overstimulated, you can visually disable lines by clicking on the circle next to the function:
Thank you, and happy minmaxing!
